"Launching is not the finish line; it is the starting gun for a race that never ends."
Deploy, Perpetually-Shipping AI Agent
The day you launch is the day your evaluation strategy must change fundamentally. In development you evaluate once against a static test set and call it done; in production the world moves under your feet. User behaviour shifts, data distributions evolve, model providers push silent weight updates, competitors raise the quality bar, and your support tickets reveal failure modes you never imagined. Post-launch monitoring is not a "nice to have" bolted on after the fact. It is the discipline that separates products which survive their first quarter from those which degrade quietly into irrelevance. This section covers the practices that keep LLM products honest in production: continuous evaluation, drift detection, retraining cadence, structured user feedback, and the model-rotation strategy that keeps you from being held hostage by any single provider.
Prerequisites
This section assumes you have shipped your AI product and completed the launch checklist from Section 70.1. Familiarity with evaluation and observability (Chapter 44) and production engineering (Chapter 45) is essential; this section builds on those foundations rather than re-establishing them.
44.4.1 Eval-in-Prod: Continuous Evaluation Replaces Pre-Launch Gates
During development your evaluation loop is simple: change a prompt, run the eval suite, check the scores, ship if they pass. This workflow assumes a stable environment. Production violates that assumption in at least three ways, every week, in every LLM product:
- User inputs diverge from your test set. Real users ask questions you never anticipated. They use slang, make typos, paste whole documents, and chain requests in ways your golden eval set does not cover. The gap between your test distribution and your production distribution widens every week.
- Model behaviour changes without your consent. API providers update model weights, adjust safety filters, and deprecate versions. A prompt that scored 92 percent on your eval suite last month may score 78 percent today because the underlying model shifted. This is not hypothetical; it is routine, and it has happened publicly to every major provider at least once.
- Success criteria evolve. What counts as a "good" answer changes as your product matures. Early users tolerate rough edges. Paying enterprise customers do not. Your evaluation thresholds must tighten over time, not stay frozen at launch values.
The solution is to treat production evaluation as a continuous pipeline, not a gate you pass once. Chapter 42 covers the mechanics of building eval sets; the discipline added here is keeping those evals alive and relevant after launch. The key shift: sample production traffic regularly, label it (automatically or with human reviewers), and feed it back into your eval suite so that your test distribution tracks your production distribution.
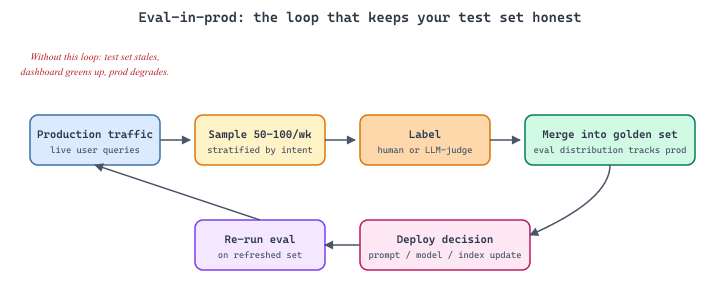
Your eval set has a half-life. An eval suite that is not refreshed with production samples becomes stale within weeks. Schedule a recurring task (weekly for high-traffic products, monthly for lower-traffic ones) to sample 50 to 100 production interactions, label them for quality, and merge them into your golden set. This single practice prevents the most common failure mode in production AI: a green eval dashboard that no longer reflects real-world performance. Tools like LangSmith, Braintrust, and Humanloop automate the sampling step; the labelling still needs human judgement, and that human time is the single most expensive line item in mature LLM operations.
44.4.2 Drift Detection: Five Flavours, Five Different Responses
"Drift" is the umbrella term for any gradual degradation in system behaviour. In traditional ML drift usually means the input data distribution has shifted. In LLM products drift has at least five flavours, each with its own detection signal and its own response. Treating them as one phenomenon is the most common mistake teams make in their first post-launch quarter.
| Drift Type | Cause | Detection Signal | Response |
|---|---|---|---|
| Input drift | User behaviour changes: new use cases, seasonal patterns, marketing campaigns bringing different audiences | Topic distribution shift in logged queries; rising "out of scope" rate | Expand eval set; update retrieval index; consider new prompt branches |
| Model drift | Provider updates model weights or safety filters without versioned notice | Quality score drop on stable eval set; output format changes; new refusal patterns | Pin model version if possible; re-tune prompts; escalate to provider |
| Context drift | Your knowledge base or retrieval corpus becomes outdated | Rising "I don't know" or hallucination rate; user corrections increasing | Schedule regular index refreshes; add freshness metadata to chunks |
| Performance drift | Latency increases due to provider load, network changes, or growing context sizes | p95 latency crossing threshold; timeout rate increasing | Review context sizes; consider caching; evaluate alternative providers |
| Cost drift | Average tokens per request growing; cache hit rates declining; user volume spiking | Cost per request trending upward; monthly bill exceeding projections | Audit prompt sizes; enforce output limits; review model routing thresholds |
The most effective drift detection runs automatically on a schedule, comparing recent production metrics against baseline values established at launch (or at the last intentional recalibration). The observability infrastructure from Chapter 42 provides the raw signals; what you need on top of it is a comparison layer that flags deviations. Prometheus alerting on a set of well-chosen LLM metrics, combined with weekly eval re-runs, is enough for most products in their first year.
Who: A startup running an AI legal research assistant on a frontier provider's API.
Situation: Eight months post-launch, the team noticed their thumbs-down rate had crept from 4 percent to 11 percent over six weeks. The static eval suite still scored 91 percent. Engineering was confused.
Investigation: A weekly sample of production traffic, labelled by a paralegal contractor, revealed that the model had started producing longer answers, citing more sources, and occasionally hallucinating case names. Cross-referencing release notes showed the provider had quietly updated the model behind their unversioned alias.
Fix: The team pinned to a specific dated model snapshot, re-tuned the prompts for the older behaviour, and rebuilt their alerting to compare the live model against the pinned baseline weekly. Thumbs-down dropped back to 5 percent within a week.
Lesson: A static eval suite catches almost no real production drift; a rolling eval suite, refreshed with production samples, catches all of it. Pin model versions in production, not in development.
44.4.3 Retraining and Re-Tuning Cadence
For purely API-based LLM products, "retraining" usually means re-tuning prompts, refreshing few-shot examples, and updating retrieval indices, not gradient descent. For products that include a fine-tuned component, real retraining is on the table. Either way, the cadence must be explicit. Teams that do not commit to a cadence end up with one of two failure modes: either they retune every week in a panic, or they never retune at all and watch quality slide. The following table is a reasonable default.
| Component | Typical cadence | Trigger for off-cycle update |
|---|---|---|
| System prompt | Every 2 to 4 weeks | Eval score drop >3 points; new feature; new failure mode |
| Few-shot examples | Monthly | Recurring failure cluster identified in production logs |
| Retrieval index | Daily to weekly (depends on data velocity) | User corrections about freshness; explicit out-of-date complaints |
| Fine-tuned adapter (LoRA) | Quarterly | Accumulated labelled data exceeds 5k high-quality pairs |
| Full fine-tune or model swap | Yearly or model lifecycle | Provider deprecation; major capability gap; cost crossover |
The discipline is to schedule the cadence and stick to it, then react to off-cycle triggers when the data demands it. Calendar reminders are not optional; the temptation to skip "this week's prompt review because everything looks fine" is what leads to "we have not touched this prompt in nine months and the score has slipped 15 points."
44.4.4 User Feedback Loops in Production
Automated metrics tell you what is happening. User feedback tells you why. The most effective production feedback systems combine three mechanisms, each catching a different signal that the others miss:
- Lightweight signals: thumbs up/down. Low friction, high volume. Users click without thinking, which is exactly what you want for statistical coverage. Track the thumbs-down rate as a leading indicator of quality degradation. A 5 percent increase in thumbs-down over a week is a stronger signal than a 2 percent drop in your automated eval score.
- Correction mechanisms. Let users edit the AI's output and save the corrected version. Each correction is a free labelled example: the AI's output is the "bad" answer, the user's edit is the "good" answer. Feed these pairs back into your eval set. Over time, your eval suite becomes a living document shaped by real user expectations.
- Escalation to human. When the AI cannot help, provide a clear path to a human agent. Every escalation is a signal that your system has a coverage gap. Log the query, the AI's attempted response, and the human's resolution. These escalation logs are the richest source of eval cases you will ever find, and they cost you nothing to collect.
Research on production AI systems consistently shows that only 3 to 7 percent of users ever click a thumbs-up or thumbs-down button. Yet that small fraction, aggregated over thousands of interactions, produces remarkably stable quality signals. Two design moves reliably double the feedback rate: place the button inline with the response (not below the fold), and make the negative signal slightly cheaper than the positive one (a single click for "bad," a one-line text box for "good"). This asymmetry biases the data toward exactly the cases you most need to fix. Nielsen Norman Group's writeup on feedback UI has the underlying research.
44.4.5 Model-Rotation Strategy: Not Being Held Hostage
The provider you launched on is rarely the provider you finish on. Models get deprecated, prices change, new entrants offer better capabilities, regulators in your geography restrict cross-border data flows. A model-rotation strategy is the explicit plan for how your product survives any of these events without a panic migration.
A workable strategy has four ingredients:
- An abstraction layer over the provider API. Calls go through a thin wrapper that exposes a stable interface and translates to whichever provider is configured. Libraries like LiteLLM and LangChain's chat-model abstraction are sufficient for most cases. The point is to keep provider-specific code in exactly one place, not sprinkled across the codebase.
- A portable eval suite. Your golden eval set must run against any candidate model with no code changes. When the news breaks that your current model is being deprecated, you should be able to re-run the eval against three alternatives within an afternoon, not three weeks.
- A second-source contract. Even if you only use one provider in production, keep a second provider configured and tested on a small slice of traffic (5 to 10 percent). This shadow deployment costs little, validates that your abstraction layer actually works, and gives you a credible fallback the moment the primary provider has an outage. The multi-CDN tradition in web infrastructure is the right mental model.
- A documented switch-over runbook. When the day comes that you must rotate, the team should already know how to drain the primary provider, validate quality on the secondary, roll back if needed, and communicate to customers. The Google SRE workbook on playbooks is the canonical reference.
The hardest provider dependencies are not in the API calls; they are in the implicit behaviours your product has come to rely on: a particular model's verbosity, its preferred output format, its safety-filter tuning, its tokeniser idiosyncrasies. Each of these creates a hidden migration cost. Run portability tests quarterly, not annually. A team that has not run their eval suite against a second provider in nine months is probably more locked in than they think, and the cost of finding out will be measured in incident-response weekends.
44.4.6 The Continuous Steering Loop
Monitoring without action is just expensive logging. The value of your monitoring infrastructure is measured by how quickly it triggers the right intervention. The interventions, ordered from lightest to heaviest, are:
- Prompt revision (lightest). Trigger: quality score drops 5 percent or more on your production eval sample, or thumbs-down rate increases by 3 percent or more over a rolling week. Action: review recent low-scoring interactions, identify the pattern, and adjust your system prompt or few-shot examples. Turnaround: hours to days.
- Model switching. Trigger: provider deprecates your current model version, or a new release offers better quality at the same price (or same quality at lower price). Action: run your eval suite against the new model, compare scores, deploy if the new model meets your thresholds. Turnaround: days. The portability strategies above make this feasible.
- Architecture changes (heaviest). Trigger: fundamental capability gap that no prompt or model change can address. Examples: needing multi-step reasoning, real-time data access, or domain-specific fine-tuning. Action: redesign the relevant pipeline component. Turnaround: weeks. Before committing, confirm the gap with data from your monitoring system, not intuition.
The key discipline is proportionality: do not redesign your architecture when a prompt tweak would suffice, and do not keep tweaking prompts when the architecture is the bottleneck. Your monitoring data tells you which level of intervention is appropriate. Trust it.
Post-launch is the longest phase of an AI product's life and the one that determines whether it survives. The first launch buys you the right to iterate. The iteration loop is what builds the product. Teams that internalise this and resource the monitoring function from day one (not as an afterthought six months in) consistently ship products that improve over time. Teams that treat launch as the goal and monitoring as someone else's job ship products that quietly decay. The choice is made on day one, in the org chart, before any code is written.
When Notion AI Q&A launched in mid-2024, the team discovered a pattern that recurred for almost a year: prompts that had passed staging on Monday started returning subtly worse answers by Tuesday afternoon. They eventually proved it was a Tuesday-morning vendor rollout window (the same window that gave us the "phantom Tuesday" in 42.4). The post-launch monitoring runbook now includes a dedicated Tuesday diff, with golden-set replay scheduled at 06:00, 12:00, and 18:00 UTC every Tuesday, and any KPI delta over 3 sigma escalated to a human within fifteen minutes. The pattern was so consistent that "Tuesday alerts" became a team standing joke at the Monday all-hands.
What Comes Next
Continue with Section 44.5 for the next online-eval pattern. After this chapter wraps, Chapter 45: Tools of the Trade surveys the observability platforms, eval frameworks, prompt-management tools, and provider abstractions that this section assumed, so you leave with a shopping list calibrated to your product's risk tier and scale.