"My latency spiked, my cost doubled, and my outputs got shorter. Three traces, three explanations, three teams to convince. Observability is the receipt you hand to each of them."
An OpenTelemetry-Emitting AI Agent
The reference for instrumenting an LLM application so you can answer the three questions every on-call engineer asks at 3am: What is broken? Who is paying for it? What changed? We cover the three classical observability pillars (metrics, traces, logs) adapted for LLM workloads, the open semantic conventions that landed in 2024-2025, the five vendor-neutral tools that have absorbed most of the production market, and the three drift modes (prompt, response, quality) plus the operational patterns (golden-set replay, shadow traffic, eval-in-prod sampling) that turn signals into safe rollouts.
The structural conceptual treatment of evaluation and production monitoring lives in Chapter 42 (Evaluation and Observability). This section is the operations counterpart: the exact OpenTelemetry spans you should emit, the difference between LangSmith and Phoenix when you have to pick one, what a Helicone proxy actually buys you over instrumenting the SDK directly, and how the legal stakes (the Air Canada chatbot tribunal ruling (2024) established that undetected quality regressions now carry contractual liability) shape what you log and how aggressively you redact. Cross-references to Section 19.11 (Libraries & Frameworks) for the offline-eval side and Section 10.7 (Libraries & Frameworks) for server-side metrics are flagged inline.
Prerequisites
This section assumes familiarity with LLM evaluation dashboards from Section 44.2 and with the model registry workflow from Section 44.1. Familiarity with statistical hypothesis testing from Section 42.2 helps when interpreting drift-detection signals.
44.3.1 The Three Pillars, LLM Edition
Classical observability has three pillars: metrics (cheap numerical aggregates), traces (per-request causal chains), and logs (high-cardinality structured events). LLM systems use all three, but the content and cardinality of each shift in ways that break naive Prometheus dashboards built for stateless REST services.
Metrics gain new dimensions: input tokens, output tokens, cache-hit ratio, and dollar-cost per request. Latency distributions stop being unimodal; for streaming endpoints you track time-to-first-token (TTFT) and inter-token latency separately, with p50, p95, and p99 percentiles that often differ by an order of magnitude (long-tail prompts can take 50x the median). Traces have to capture the prompt, the rendered template, the retrieved documents, every tool call, and the final response; a single user-facing turn in an agent can fan out to 30+ spans. Logs have to redact PII at the SDK level because the prompt body is now part of the payload, and prompt strings exceed the line limits of most log shippers.
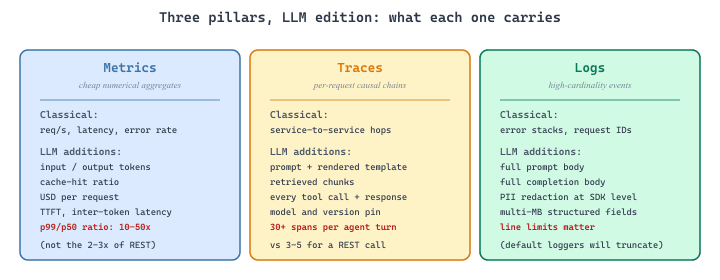
For classical services, p99 latency is usually 2 to 3x p50. For LLM services it is routinely 10 to 50x p50 because long inputs and reasoning traces are heavy-tailed. Alerting on the mean (or even p95) hides outages that affect specific user segments. Always alert on p99 and on the tail-shape ratio p99/p50.
44.3.2 OpenLLMetry and the GenAI Semantic Conventions
Until 2024, every observability vendor invented its own attribute names: was the token count llm.usage.total_tokens, gen_ai.usage.tokens, or tokens_used? The OpenTelemetry community resolved this with the GenAI semantic conventions, which moved from experimental to stable across 2024-2025. The conventions define a span schema covering provider, model, request parameters, prompt and completion content, token counts, finish reason, and tool calls.
OpenLLMetry, maintained by Traceloop, is the reference SDK implementation. It is OpenTelemetry under the hood, ships with auto-instrumentors for OpenAI, Anthropic, Bedrock, Vertex AI, Cohere, LangChain, LlamaIndex, Haystack, and most vector stores, and emits the standard GenAI attributes by default. Because it is plain OpenTelemetry, you point it at any OTLP-compatible backend (Phoenix, Honeycomb, Datadog, Grafana Tempo, Jaeger), not a proprietary one. Auto-instrumentation looks like this:
from traceloop.sdk import Traceloop
from openai import OpenAI

# One-line instrumentation: every OpenAI call now emits OTel spans
# with prompt, completion, token counts, and latency.
Traceloop.init(
    app_name="support-bot",
    api_endpoint="https://api.traceloop.com",  # or your own OTel collector
    disable_batch=False,
)

client = OpenAI()
response = client.chat.completions.create(
    model="gpt-4o",
    messages=[{"role": "user", "content": "Summarize the refund policy."}],
)
# Span captured: gen_ai.system=openai, gen_ai.request.model=gpt-4o,
# gen_ai.usage.input_tokens, gen_ai.usage.output_tokens, latency_ms,
# gen_ai.response.finish_reasons, plus the rendered prompt and response.Traceloop.init(app_name=...) call wires the standard GenAI semantic-convention attributes (model, input/output tokens, finish reason, prompt and completion bodies) into every subsequent OpenAI request, with no per-call changes to the SDK. Point api_endpoint at your own OTel collector to keep traces local.Production teams typically run a local OTel Collector as a sidecar, dual-writing spans to a long-term store (S3 or a managed service) and a hot store (Phoenix or Tempo) for interactive debugging. This pattern survives vendor swaps because the SDK and the span format are open.
44.3.3 The Tool Landscape
Five tools cover the bulk of the production market in 2025-2026. They differ on three axes: self-hostability, depth of LLM-specific analysis, and whether they replace your existing observability stack or sit alongside it.
Arize Phoenix (open source, Apache 2.0) is an OTel-native, locally runnable trace viewer with built-in LLM eval views (groundedness, relevance, toxicity scores per span). It is the right default for teams that want to own their data and have an existing OTel collector. Phoenix ships with Jupyter integration so you can pull traces into a notebook and slice them with pandas.
LangSmith from LangChain is the deepest tool if you are already building on LangChain or LangGraph. It captures the framework-internal state (graph node transitions, tool routing decisions, memory updates) that generic OTel spans miss. SaaS-first; the self-hosted tier is enterprise-licensed. As of 2025 LangSmith works with non-LangChain code via its tracing SDK but the value drops sharply outside the LangChain stack.
Helicone takes a different architectural stance: it is an LLM gateway proxy. You change your base URL from api.openai.com to oai.helicone.ai/v1 and pass a Helicone API key; every request flows through their proxy, which logs the full prompt and response, deduplicates with a request cache, and exposes per-user cost dashboards. The proxy model trades a small added latency for zero application-side code changes, which is decisive when you are instrumenting a legacy codebase or third-party SaaS that you cannot modify. Helicone open-sourced its core in 2024 and self-hosting is a documented path.
Pydantic Logfire is the newer entrant (GA in 2024) from the Pydantic team. It is a managed OTel backend with first-class Python ergonomics: logfire.instrument_openai() and logfire.instrument_anthropic() produce dashboards without any other configuration. Logfire is the easiest on-ramp for FastAPI-heavy stacks and integrates cleanly with Pydantic AI agents.
Langfuse is a self-hosted-first competitor to LangSmith with an MIT-licensed core. As of 2025 it offers prompt management (versioned templates with A/B routing), eval-in-prod sampling, and per-session timelines. Langfuse is the standard answer when an enterprise will not accept SaaS-only data residency.
| Tool | Self-host | Pricing model | LLM-specific depth | Best fit |
|---|---|---|---|---|
| Arize Phoenix | Yes (Apache 2.0) | Free OSS; Arize SaaS for managed | High (eval scoring built in) | OTel-native teams, notebooks |
| LangSmith | Enterprise tier only | SaaS, per-trace | Very high if on LangChain | LangChain / LangGraph apps |
| Helicone | Yes (MIT core) | Free OSS; SaaS per-request | Medium (proxy logs only) | Legacy / SDK-locked stacks |
| Pydantic Logfire | No (managed only) | SaaS, per-span | Medium (general OTel + LLM) | FastAPI + Pydantic ecosystems |
| Langfuse | Yes (MIT core) | Free OSS; SaaS for managed | High (prompt mgmt included) | Enterprise self-host, prompt versioning |
Every tool above ships with the prompt body in the trace by default. If your prompts contain customer data (names, emails, account numbers, medical text), enabling tracing on day one of a production deployment is a privacy incident waiting to happen. Configure redaction at the SDK level (OpenLLMetry's Traceloop.init(disable_content_tracing=True) or per-span filters) before flipping the switch in production. The Air Canada chatbot tribunal ruling (2024) turned on a logged transcript; you want those logs, but you want them governed.
44.3.4 Practical Vendor Cases
Three named 2024-2025 cases ground the choices. Shopify, in a 2024 AI Engineer Summit talk, migrated Shopify Magic from a custom logging stack to OTel + Phoenix because the SDK-neutral standard let them swap model providers without touching observability code. Notion's 2024 engineering blog documented using Helicone's caching proxy to cut Anthropic spend by ~30% on retrieval-augmented summaries. Cursor credited LangSmith with debugging autocomplete tool-routing drift after a mid-2024 model upgrade, citing LangGraph node-transition visibility. For server-side metrics (GPU utilization, KV cache pressure, batch size) see vLLM & Inference Servers (vLLM and TGI Prometheus exporters); join them to the application traces in this section by request ID.
- Chapter 42 (Evaluation and Observability) for the conceptual framing and offline-eval pipeline.
- Section 19.11 (Libraries & Frameworks) for offline training-side logging in W&B and MLflow.
- Section 10.7 (Libraries & Frameworks) for server-side metrics (vLLM, TGI Prometheus exporters).
- Section 44.3.5 (The Three Drift Modes) for what to do with the traces once you have them.
44.3.5 The Three Drift Modes
Classical ML monitoring assumes the model is fixed and the data shifts around it. LLM systems break that on both sides: the model can change (when a vendor updates GPT-4o behind the same endpoint) and the data can change (when users adapt their prompting style). Three drift modes apply:
Prompt drift: the distribution of user queries shifts. A support bot trained on "reset my password" starts seeing "your December invoice is wrong"; a code assistant for Python starts seeing TypeScript. Detect it via embedding distributions, topic clusters, or per-token-budget shifts over rolling windows.
Response drift: the model's output behavior changes for fixed inputs. This is the new failure mode in 2024-2026, almost entirely caused by vendor-side model updates. When OpenAI replaces gpt-4o-2024-08-06 with a newer snapshot under the floating gpt-4o pointer, your prompts may produce 20% more tokens, different formatting, or new refusal patterns. Detect it with a fixed golden-set replay: a curated 50-500 prompt set called hourly and diffed against the previous run.
Quality drift: faithfulness, groundedness, helpfulness, or safety scores degrade even when prompts and model are nominally fixed. Hardest to detect because evaluating outputs costs money and time. Standard approach: eval-in-prod sampling on 1-5% of traffic with an LLM-as-judge or cheap classifier, alerting on the trailing average. Ragas (matured through 2024) is the standard for RAG metrics; DeepEval covers general LLM eval-in-prod.
Response drift is the silent killer. Your dashboards still show p99 latency green and error rate at zero; your support tickets quietly tick up two weeks after the vendor model was updated. The only defense is a hash-pinned golden set you replay continuously, plus an explicit policy on which model pointers (snapshot vs floating) you tolerate in production.
44.3.6 Hash-Pinned versus Floating Model Versions
Vendors offer two naming patterns, each pushing response-drift risk to a different party. Hash-pinned snapshots (gpt-4o-2024-11-20, claude-sonnet-4-5, gemini-2.5-pro-001) are immutable: the same prompt produces a deterministic distribution until the vendor sunsets the snapshot. Floating pointers (gpt-4o, claude-3-5-sonnet-latest) resolve to whatever the vendor considers current at request time. Floating gives free upgrades; pinned gives stable behavior. Anthropic's deprecation policy commits to 6 months notice; OpenAI's documents an analogous timeline. Production teams almost always pin and qualify new snapshots against the eval suite before bumping the config. The Air Canada case sits on this seam: the airline did not control the underlying model and could not roll back the chatbot's hallucinated policy.
44.3.7 The Open-Source Drift Stack
Four tools cover most of the OSS drift-detection market. Evidently AI (Apache 2.0) added LLM-specific tests in 2024 for text-quality drift, toxicity scoring, and prompt-template adherence. WhyLabs LangKit turns text into numeric signals (readability, sentiment, jailbreak-attempt probability) that feed any existing detector. NannyML focuses on quality estimation without ground truth, the realistic case in production. For RAG, Ragas computes faithfulness, answer-relevance, and context-recall scores and is now first-class in LangSmith, Phoenix, and Langfuse. For agents, DeepEval and OpenAI Evals wire LLM-as-judge prompts into the monitoring loop. The 2025 pattern: emit traces (Section 44.3.1), sample 1 to 5%, run a judge, store the score as a span attribute, alert on the trailing 24-hour mean by user-segment.
44.3.8 Operational Patterns
The drift signals are useless without an operational pattern that turns them into safe rollouts. Three patterns recur across mature LLM production teams:
Golden-set replay (nightly): maintain a curated set of 50 to 500 prompts that cover your traffic distribution. Each night a job re-runs them against the current production configuration and diffs the outputs against the last accepted run. Failures fire an alert; the on-call engineer compares the diffs and either approves or rolls back. This is the cheapest layer of defense and catches response drift from vendor model updates within 24 hours.
Shadow traffic: when you want to qualify a new model or a new prompt, mirror live requests to a parallel inference path that does not return user-visible output. Compare aggregate metrics (response length, refusal rate, eval-in-prod quality score) between the shadow and live paths; promote when shadow is statistically not worse. vLLM & Inference Servers covers the serving-side details; here we care about the diffing logic, which Ragas and DeepEval support out of the box.
Eval-in-prod (continuous): sample a small fraction of live traffic, run an LLM-as-judge or a classifier, store the score, alert on trends. The cost trade-off is straightforward: a 1% sample with a cheap judge costs roughly 1% of total inference, which buys you continuous quality signal. Below is a minimal pattern using OpenLLMetry trace attributes plus a Ragas judge:
import random
from ragas.metrics import Faithfulness
from openai import OpenAI

client = OpenAI()
judge = Faithfulness()
SAMPLE_RATE = 0.02  # 2% eval-in-prod sampling

def chat_with_eval(messages, retrieved_docs):
    response = client.chat.completions.create(
        model="gpt-4o-2024-11-20",  # hash-pinned, NOT "gpt-4o"
        messages=messages,
    )
    answer = response.choices[0].message.content
    if random.random() < SAMPLE_RATE:
        score = judge.score(
            question=messages[-1]["content"],
            answer=answer,
            contexts=retrieved_docs,
        )
        # Attach as OTel span attribute for trend dashboards
        from opentelemetry import trace
        trace.get_current_span().set_attribute("eval.faithfulness", score)
return answerrandom.random() < SAMPLE_RATE) routes a tiny fraction of live traffic through Ragas Faithfulness, then attaches the score to the current OTel span. The hash-pinned gpt-4o-2024-11-20 in the call (not the floating gpt-4o) is what isolates this trace from vendor-side response drift.44.3.9 Tool Comparison
| Tool | Drift Type Covered | Self-host | Best For |
|---|---|---|---|
| Evidently AI | Prompt + response (text drift) | Yes (OSS) | Streamlit dashboards, batch reports |
| WhyLabs LangKit | Prompt features (toxicity, jailbreak) | Yes (OSS feature lib) | Feeding existing drift detectors |
| NannyML | Quality estimation without labels | Yes (OSS) | Production where ground truth is rare |
| Ragas | RAG faithfulness, context recall | Yes (OSS) | Retrieval-augmented apps |
| DeepEval | General LLM eval-in-prod | Yes (OSS) | LLM-as-judge in CI and prod |
Using gpt-4o to judge gpt-4o introduces correlated drift: when the vendor updates the model, both the answer and the judge change, and your monitoring goes silently blind. Pin the judge to a different model family (use Claude to judge GPT, or vice versa) or pin the judge to a hash-locked snapshot you upgrade on a separate cadence. The cost overhead is real but cheaper than the next Air Canada-class tribunal ruling.
44.3.10 Real-World Case: Anthropic's Model-Version Policy
Anthropic publishes its model deprecation policy: 6 months notice before any pinned snapshot retires, with behavior-diff documentation. This lets you plan the qualification cycle, run the new snapshot against your eval suite, diff it against the pinned snapshot, and re-qualify monitoring thresholds before cutover. OpenAI and Google publish analogous (less formal) policies. For self-hosted open-weights models (Llama-3, Mistral, Qwen via Hugging Face Hub) the version is whatever you downloaded; drift comes only from upgrades you initiate, but the qualification cost moves to you.
- Chapter 42 (Evaluation and Observability) for the underlying eval methodology.
- Section 19.11 (Libraries & Frameworks) for the offline eval pipelines that feed your golden set.
- Appendix G (War Stories) for the Air Canada and Chevy of Watsonville cases as concrete failure modes.
- Section 71.1 (Platforms) for the canary and shadow patterns that pair with drift monitoring.
Objective
Wire Langfuse (the open-source LLM observability platform) to a small multi-step retrieval-and-answer agent, generate 100 traces, and verify that each span carries the right attributes (model name, token counts, latency, prompt, response, evaluation scores). By the end, you should be able to filter the Langfuse UI for slow traces and confirm the bottleneck step.
Setup
Use Langfuse Cloud's free tier (or self-host with docker compose; both follow the same API). The sample agent retrieves from a local FAISS index of 200 Wikipedia paragraphs and answers with GPT-4o-mini. You need an OpenAI key and the Langfuse public/secret key pair.
pip install langfuse openai faiss-cpu sentence-transformersSteps
- Bootstrap the index: Pull 200 Wikipedia paragraphs from the
wikipediaPython package, encode withall-MiniLM-L6-v2, build a FAISS index. - Build the agent: Write
answer(question)with three steps:retrieve()(top-5 from FAISS),rerank()(LLM scores each chunk 0 to 10), andgenerate()(LLM answers using the top-2 reranked chunks). Each step is its own function. - Instrument with Langfuse decorators: Import
@observe()fromlangfuse.decoratorsand decorate the three step functions. Uselangfuse.openaias a drop-in foropenaiso chat completions are logged automatically. - Generate 100 traces: Loop over 100 questions (a mix of factual and ambiguous), call
answer()for each. Addlangfuse_context.score(name="length_ok", value=int(len(answer) < 500))insidegenerate(). - Verify in the UI and via API: In the Langfuse dashboard, filter traces with latency > p95. Then call
langfuse.fetch_traces(limit=10)and assert each trace has 3 spans, each span hasinput,output,usage, and at least one score.
Expected Output
The Langfuse UI shows 100 traces with 3 spans each (retrieve, rerank, generate). Rerank typically dominates latency since it makes one LLM call per chunk. Token usage totals should add up across the spans and match the OpenAI dashboard within a few percent.
Extension
Add an LLM-as-judge score for answer faithfulness, surface it in the Langfuse UI as a custom score column, and set up an alert when the rolling 1-hour average drops below 0.85.
Charity Majors (the Observability Engineering co-author quoted at the top of this section) coined what Honeycomb engineers internally call the "3am rule" in a 2024 KubeCon keynote: every span attribute should help an on-call engineer at 3am answer one of three questions in under thirty seconds. When Honeycomb's own LLM-augmented support search was being instrumented in late 2024, the team taped a yellow Post-it next to the laptop of whoever was on prompt-eng rotation that just said "3am". Anything the model emitted that did not pass the test (a sprawling thought trace, an un-redacted email body, a tool call with no parent ID) got cut. The dashboard, by the time it shipped, fit on one screen.
- The three pillars (metrics, traces, logs) still apply, but LLM workloads need token-level cost dimensions, TTFT separated from total latency, and alerts on p99 and tail-shape ratios because LLM latency is heavy-tailed.
- OpenTelemetry GenAI semantic conventions (stable in 2024-2025) and OpenLLMetry are the open standard; instrumenting against them keeps you portable across backends.
- Pick the platform by axis: Phoenix for OSS + OTel-native, LangSmith for LangChain depth, Helicone for zero-code proxy logging, Logfire for FastAPI ergonomics, Langfuse for self-hosted prompt management.
- Three drift modes apply to LLMs: prompt drift (user queries shift), response drift (vendor model updates), and quality drift (faithfulness or safety scores degrade).
- Always hash-pin model versions in production (
gpt-4o-2024-11-20notgpt-4o) and treat upgrades as deliberate release events with eval qualification. - Combine three operational patterns: nightly golden-set replay (cheap, catches response drift), shadow traffic (qualifies new versions), and eval-in-prod sampling (catches quality drift continuously).
- Open-source stack: Evidently for text drift, WhyLabs LangKit for features, NannyML for unlabeled quality estimation, Ragas for RAG, DeepEval for LLM-as-judge.
- Pick a different model family for your LLM judge than for the system you are judging, to avoid correlated drift that silently disables your monitoring. Redact prompts at the SDK level before enabling production tracing; logged transcripts are now legally binding evidence in some jurisdictions.
Set up the three operational patterns for a toy chat service: (a) a 50-prompt golden set that runs nightly with a pass/fail threshold of 95% on exact-match-or-judge-approves; (b) shadow traffic that mirrors 5% of live requests to a candidate model; (c) eval-in-prod sampling that scores 1% of live responses with an LLM judge. Log everything to one tracing backend (Langfuse, Phoenix, or Arize) and verify all three pipelines emit traces.
Answer Sketch
Pipeline (a) takes 30 to 60 minutes of compute per night and gives a hard quality floor. Pipeline (b) requires only an async fan-out wrapper around the LLM call; the candidate output is discarded. Pipeline (c) requires sampling at the SDK level plus a queue for judge calls so production latency is not affected. Common bug: routing (a) and (c) through the same judge prompt; pin the prompt versions to detect drift in the evaluator itself.
You judge a GPT-4o-based production system with GPT-4o-as-judge. After a routine OpenAI model update, your dashboard shows quality has improved by 8 points overnight. Diagnose two plausible reasons this signal is misleading and propose a change to the judging setup.
Answer Sketch
(1) The judge and the system share an update path: a new GPT-4o version may simply rate its own family more leniently, so the apparent gain is correlated drift in the evaluator. (2) The system and the judge may now use the same hidden chain-of-thought, so judge "reasons through" exactly the way the system did and approves. Fix: route judging to a different family (Claude, Gemini) and pin the version. Regression should be measured by humans on a small sample whenever the judge or system family changes.
Observability tells you when something has shifted; the next question is how to act on that signal without thrashing the system. Continue to Section 44.4: Post-Launch Monitoring and Iteration for the playbook that turns alerts into shipped improvements.