"Your model did not break. It just quietly became a different model when the provider updated their weights last Tuesday."
Sentinel, Quietly Drifting AI Agent
LLM applications degrade silently. Unlike traditional software that crashes loudly when something breaks, LLM systems can quietly produce worse outputs without any errors or exceptions. The operational treatment of drift, including the three drift modes (prompt, response, quality), the OSS (Open-Source Software) tooling stack (Evidently, WhyLabs LangKit, NannyML, Ragas, DeepEval), and the operational patterns (golden-set replay, shadow traffic, eval-in-prod) lives in Section 44.3; the expanded five-flavor taxonomy (input, model, context, performance, cost) lives in Section 44.5. This section adds the foundational statistical framing (drift as covariate shift: when production data slowly stops resembling the validation data that anchored your quality estimates) and the retraining-and-intervention trigger logic that the operational sections call back to.
Prerequisites
This section builds on the observability material from Section 44.4. Understanding fine-tuning from Section 16.1 and alignment from Section 18.1 helps with understanding evaluation of model adaptation quality.
42.4.4 The Three Drift Modes and How Each Is Detected
The fuller operational treatment of these modes (tooling, golden-set replay, shadow traffic) lives in Section 44.3, and the expanded five-flavor taxonomy in Section 44.5. But you do not need to leave this section to understand what each mode is and how you catch it. An LLM application drifts along three distinguishable axes, each with its own diagnostic signal:
- Prompt / input drift. The distribution of incoming requests changes: users start asking new kinds of questions, or the system prompt accumulates untracked edits from multiple authors. Diagnostic signal: compare the embedding distribution of recent inputs against a frozen reference set (population stability index, or a two-sample test on input embeddings). A rising distance means the inputs no longer resemble what you validated on.
- Response / output drift. The same prompt starts producing differently shaped outputs, typically because the provider silently rotated the model behind an unpinned endpoint. Diagnostic signal: track output-distribution statistics (length, refusal rate, JSON-validity rate, token-distribution shift) and the
system_fingerprintfield; a discontinuity with no deploy on your side points to provider drift. - Quality drift. Inputs and outputs may look statistically normal while the actual usefulness of answers degrades. Diagnostic signal: run your evaluation suite (LLM-judge or golden-set scoring) on a daily sample of production traffic and watch the score against its validated baseline; a drop below the baseline minus a few standard deviations triggers investigation.
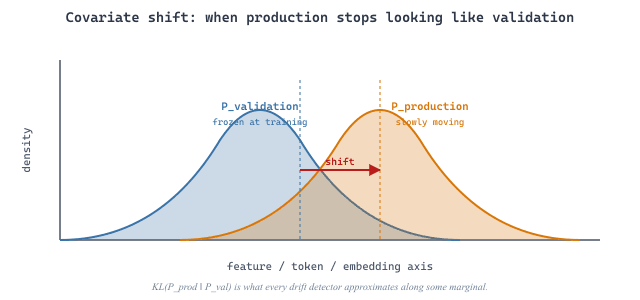
The three modes share one statistical root. Each is a form of covariate shift (Shimodaira, 2000): the system is a learned approximation conditioned on a frozen distribution, so any change to that conditioning distribution invalidates the approximation. Concretely, let $P_{\text{val}}$ be the distribution of inputs (or input embeddings) the system was validated on and $P_{\text{prod}}$ the distribution it now sees in production. The single quantity every monitor approximates along some marginal is the Kullback-Leibler divergence
$$D_{KL}(P_{\text{prod}} \Vert P_{\text{val}}) = \sum_{x} P_{\text{prod}}(x) \, \log \frac{P_{\text{prod}}(x)}{P_{\text{val}}(x)} .$$
Intuitively, $D_{KL}$ measures the expected extra surprise of describing production data with a model fitted to validation data: it is zero when the two distributions coincide and grows as production data moves into regions the validation set rarely covered. Input-drift detectors estimate this divergence on the input marginal, response-drift detectors on the output marginal, and quality-drift detectors on the joint of inputs and judged scores. This is why a single conceptual diagnostic, "how far has the production distribution moved from the validated one?", underlies all three monitoring strategies.
42.4.5 Retraining and Intervention Triggers
All three drift dimensions are instances of one principle: the deployed system is a learned approximation conditioned on a frozen distribution, and any change to the conditioning distribution invalidates the approximation. The formal name is covariate shift (Shimodaira, 2000), and the diagnostic is the same regardless of whether the input distribution shifted (user behavior), the embedding distribution shifted (model update), or the prompt-conditional distribution shifted (silent provider update): the joint distribution P(x, y) of evaluation triples drifts from the joint it was validated on. Every monitoring strategy in this section is approximating DKL(Pprod ‖ Pval) along some marginal.
The best drift detection strategy is a continuous evaluation pipeline that runs your evaluation suite on a sample of production traffic every day. Compare today's scores against the baseline established when the system was last validated. When you detect degradation, correlate it with known changes (prompt updates, provider version changes, data updates) to identify the root cause quickly. Automated intervention triggers should start with conservative actions (investigate, alert) and only escalate to disruptive actions (rollback, reindex) when the evidence is strong.
Who: ML operations team at a healthcare information company running a symptom-checking chatbot
Situation: The chatbot used an OpenAI model endpoint without a pinned version. One Monday morning, response quality metrics dropped, but error rates remained at zero and latency was normal.
Problem: The provider had silently updated the model version over the weekend. The chatbot continued to function, but its medical triage accuracy degraded from 94% to 81% on their internal evaluation set. Without proactive monitoring, the team would not have noticed for days.
Dilemma: Pinning to an older model version preserved accuracy but would eventually reach end-of-life. Always using the latest version meant accepting unpredictable quality changes. Neither approach alone was sufficient.
Decision: The team implemented a three-layer drift detection system: model version fingerprinting, continuous evaluation sampling, and embedding stability monitoring.
How: They pinned the model to a dated version (e.g., gpt-4o-2024-08-06) and logged the system fingerprint from each API response. A background job evaluated 50 sampled production queries daily against their golden test set. When a new model version became available, they ran their full evaluation suite before switching. Embedding drift was tracked by computing pairwise cosine similarity on a fixed reference set weekly.
Result: The system now detected model changes within hours instead of days. When the provider released a new version, the team's evaluation suite ran automatically, and the switch was made only after confirming accuracy met their 92% threshold. They never again experienced an undetected quality degradation.
Lesson: Pin model versions, log system fingerprints, and run continuous evaluation against golden test sets; silent degradation is the most dangerous failure mode for LLM applications because it produces no errors to alert on.
Assign a unique trace ID to every user request and propagate it through all components (retrieval, model calls, post-processing). When something breaks, this ID lets you reconstruct the full execution path in seconds instead of hours.
Open Questions in Drift Detection (2024-2026):
- Semantic drift detection: Beyond embedding distance, how do you detect subtle changes in model behavior like shifts in reasoning style, declining nuance, or increased refusal rates? Behavioral fingerprinting approaches that characterize model behavior across a diverse probe set are emerging.
- Causal drift attribution: When multiple components change simultaneously (prompt, model, data), attributing degradation to a specific cause requires causal inference techniques adapted from observational studies.
- Predictive drift monitoring: Can we predict quality degradation before it affects users by monitoring leading indicators like input distribution shift or prompt template divergence?
Explore Further: Build a drift detection pipeline that tracks embedding stability on a fixed reference set, then simulate a provider model update to see how quickly your pipeline detects the change.
On Tuesday, 21 May 2024, the Stack Overflow Developer Survey results began showing oddly truncated AI summaries on the dashboard. Nothing had been deployed; the on-call team eventually traced it to a silent OpenAI snapshot rotation behind the floating gpt-4 alias. The internal incident was nicknamed "the phantom Tuesday" because there was no log entry, no error, no version bump on their side, just a quiet 9 percent shift in the output token distribution. Within a fortnight, hash-pinned model identifiers were policy across the company's LLM stack, and "did anything roll on a Tuesday?" became the first question their drift-monitoring runbook asks.
- LLM applications degrade silently. Unlike traditional software that crashes visibly, LLM systems produce gradually worse outputs without errors. Proactive monitoring is the only way to detect this degradation.
- Monitor along multiple drift dimensions. The three modes (prompt, response, quality) are introduced in Section 44.3, and an expanded five-flavor taxonomy (input, model, context, performance, cost) appears in Section 44.5. Each requires its own detection signal and intervention policy.
- Sample and evaluate production traffic continuously. Use asynchronous evaluation on a representative sample of production requests to track quality metrics over time without adding latency or excessive cost.
- Pin model versions in production. Never use unversioned model endpoints (such as "gpt-4o" without a date suffix). Always pin to a specific version and validate new versions with your evaluation suite before adoption.
- Automate intervention triggers conservatively. Start with investigation and alerting. Only escalate to automatic rollback or reindexing when you have strong evidence and well-tested automation.
1. Why is provider version drift particularly dangerous for production LLM applications?
Show Answer
2. What happens when an embedding model is updated but the document index is not re-embedded?
Show Answer
3. How does the pairwise similarity stability method detect embedding drift?
Show Answer
4. Why should quality monitoring use sampling rather than evaluating every production response?
Show Answer
5. Describe a scenario where prompt drift and provider drift interact to cause a subtle failure.
Show Answer
Exercises
Name and define three categories of drift specific to LLM systems. For each, explain why it is harder to detect than traditional ML data drift.
Answer Sketch
Prompt drift: gradual, untracked changes to prompts by multiple team members. Hard to detect because prompts are often stored as strings in code, not in a versioned system. Model drift: the provider updates the model behind the same API endpoint. Hard to detect because there is no notification and behavior changes are subtle. Behavioral drift: the model's output style or accuracy shifts due to any upstream change. Hard to detect because LLM outputs are high-dimensional text, not simple numeric features.
Write a Python function that computes three real-time quality signals from LLM responses: (1) average response length, (2) refusal rate (responses containing "I cannot" or similar phrases), and (3) JSON validity rate (for structured output tasks). Track these over a sliding window of the last 1,000 requests.
Answer Sketch
Use a collections.deque(maxlen=1000) to store recent responses. For each new response, append it and compute: (1) mean of len(r) for all responses in the deque, (2) count responses matching a regex for refusal patterns divided by total, (3) count responses where json.loads(r) succeeds divided by total. Emit these as metrics to your monitoring system. Alert when any metric deviates more than 2 standard deviations from the 7-day baseline.
Your LLM chatbot's user satisfaction score dropped from 4.2 to 3.8 over two weeks, but no code changes were made. Walk through a systematic investigation to identify the root cause, including which drift types to check first.
Answer Sketch
Step 1: Check for model drift (did the provider update the model?). Compare canary test scores before and after. Step 2: Check for data drift (did user query patterns change?). Analyze embedding distributions of recent vs. baseline queries. Step 3: Check for prompt drift (did anyone edit the system prompt?). Review prompt version history. Step 4: Check for knowledge base drift (were documents added/removed?). Review retrieval quality metrics. Step 5: Check external dependencies (did any API the agent calls change?). The most common cause is an unannounced provider model update.
Explain the tradeoff between alert sensitivity and alert fatigue in LLM monitoring. How would you set thresholds for latency, error rate, and quality score alerts? What is the role of anomaly detection?
Answer Sketch
Too sensitive: alerts fire on normal variation, team ignores them. Too lenient: real issues go undetected. Approach: use rolling baselines rather than fixed thresholds. Alert on latency when p99 exceeds 2x the 7-day rolling average. Alert on error rate when it exceeds the baseline plus 3 standard deviations. Alert on quality score when the daily average drops below the 7-day rolling average minus 2 standard deviations. Anomaly detection (e.g., isolation forest on metric time series) adapts to changing baselines automatically and reduces false positives.
Design and sketch the layout of an LLM monitoring dashboard with panels for: model performance (canary scores), user experience (latency, satisfaction), cost tracking (daily spend, cost per query), and drift indicators (embedding distribution shift). Explain which panels should trigger pages vs. tickets.
Answer Sketch
Top row: canary test pass rate (page if below 85%), user satisfaction trend (ticket if drops 10%). Middle row: p50/p99 latency (page if p99 exceeds SLA), error rate (page if above 2%), request volume (context only). Bottom row: daily cost with budget line (ticket if 130% of budget), cost per query trend, embedding drift score (ticket if above threshold). Use red/yellow/green color coding. Pages go to on-call for immediate issues; tickets are queued for next business day investigation.
What Comes Next
In the next section, Section 42.5: Evaluation-Driven Quality Gates, we address experiment reproducibility, the practices that make LLM research and development results trustworthy and repeatable.