"You cannot debug what you cannot see. And in LLM applications, almost everything is invisible by default."
Sentinel, Trace-Hungry AI Agent
You cannot debug what you cannot see. LLM applications involve chains of prompts, retrieval steps, tool calls, and generation steps that are invisible without proper instrumentation. When a user reports a bad response, you need to trace back through the entire execution: what was the prompt? What context was retrieved? What tool calls were made? How long did each step take? Observability is the practice of instrumenting your system so that you can answer these questions for any request, at any time. This section covers LLM-specific tracing concepts and the major platforms that provide this capability. The production engineering patterns from Section 11.3 introduced the logging and monitoring foundations that observability extends.
Prerequisites
This section requires the evaluation foundations from Section 42.6 and observability concepts from Section 42.4. Understanding production deployment concerns from Section 11.3 provides context for monitoring LLM systems in production.
42.6.1 LLM Tracing Concepts
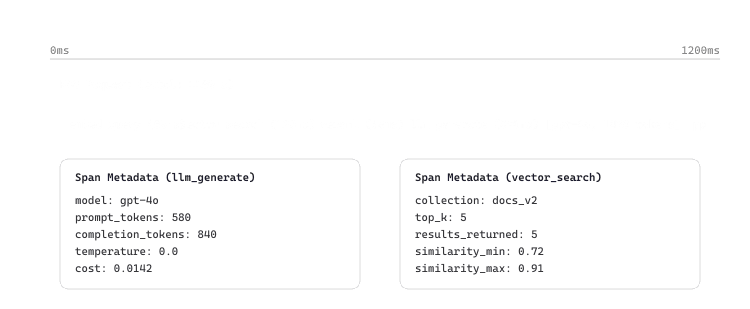
LLM tracing extends distributed tracing to LLM-specific operations. A trace represents a single end-to-end request through your application. Each trace contains spans for individual operations: an LLM call, a retrieval query, a tool invocation, or a custom function. Spans capture inputs, outputs, latency, token counts, model parameters, and any metadata you attach.
Without tracing, debugging an LLM application is like debugging a web server by reading the access log backwards while blindfolded. Most teams only invest in observability after their first "it worked yesterday" incident, which typically occurs within the first week of production.
Start your observability investment with tracing, not metrics. A single trace showing a slow retrieval call or a hallucinated response is worth more than a week of aggregate latency dashboards. You can always derive metrics from traces later, but you cannot reconstruct traces from metrics.
The trace hierarchy for a typical RAG application looks like this: a root span for the entire request, child spans for embedding the query, searching the vector store, constructing the prompt, calling the LLM, and post-processing the response. Each span records its duration, enabling you to identify performance bottlenecks at a glance. Figure 42.6.1 shows the anatomy of an LLM trace.
Traces are the unit of debugging for LLM applications. In traditional web services, you can reproduce a bug by replaying the HTTP request. In LLM applications, the same request may produce a different output tomorrow. This makes traces invaluable: they are the only record of what actually happened during a specific interaction. A trace captures the exact retrieved documents, the exact prompt that was constructed, the exact model response, and the exact latency at each step. Without traces, post-hoc debugging becomes guesswork. With traces, you can replay the decision chain for any problematic interaction and identify exactly which component failed. The drift monitoring techniques in Section 44.6 build directly on this tracing infrastructure.
42.6.2 Instrumenting with Langfuse
Langfuse is an open-source LLM observability platform that supports tracing, prompt management, evaluation, and cost tracking. It runs self-hosted or as a managed service. Its Python SDK offers both a decorator-based API for easy instrumentation and a low-level API for custom spans.
# implement rag_pipeline, retrieve_documents, generate_answer
from langfuse.decorators import observe, langfuse_context
from langfuse.openai import openai # drop-in replacement with tracing
# The @observe decorator automatically creates traces and spans
@observe()
def rag_pipeline(query: str) -> str:
    """RAG pipeline with automatic Langfuse tracing."""
    # Each decorated function becomes a span in the trace
    context_docs = retrieve_documents(query)
    answer = generate_answer(query, context_docs)
    return answer
@observe()
def retrieve_documents(query: str) -> list[str]:
    """Retrieve relevant documents from vector store."""
    # Add custom metadata to the current span
    langfuse_context.update_current_observation(
        metadata={"collection": "knowledge_base_v2", "top_k": 5}
    )
    # Retrieval logic here...
    docs = ["Document 1 content...", "Document 2 content..."]
    return docs
@observe()
def generate_answer(query: str, docs: list[str]) -> str:
    """Generate answer using retrieved context."""
    context = "\n".join(docs)
    # The Langfuse OpenAI wrapper auto-traces this call
    response = openai.chat.completions.create(
        model="gpt-4o",
        messages=[
        {"role": "system", "content": f"Answer based on context:\n{context}"},
        {"role": "user", "content": query},
        ],
        temperature=0,
    )
    return response.choices[0].message.content
# Traces appear automatically in the Langfuse dashboard
result = rag_pipeline("What are the benefits of RAG?")rag_pipeline with auto-traced OpenAI calls via the Langfuse wrapper: every retrieval + generation step appears in the Langfuse dashboard without manual instrumentation.The from langfuse.openai import openai import is a drop-in replacement for the standard OpenAI client. It automatically captures all LLM call details (model, tokens, latency, cost) without any code changes. This is the easiest way to add tracing to an existing application. Similar wrappers exist for other providers and frameworks.
42.6.3 Tracing with LangSmith
LangSmith is the observability platform built by the LangChain team. It provides tracing, evaluation,
datasets, and prompt versioning. If you use LangChain or LangGraph, LangSmith tracing integrates
automatically. For non-LangChain applications, the traceable decorator provides similar
functionality.
# implement answer_question, search_knowledge_base, call_llm
from langsmith import traceable, Client
from openai import OpenAI
import os
# Enable LangSmith tracing via environment variable
os.environ["LANGCHAIN_TRACING_V2"] = "true"
os.environ["LANGCHAIN_PROJECT"] = "my-rag-app"
client = OpenAI()
@traceable(run_type="chain")
def answer_question(question: str) -> dict:
    """Answer a question with LangSmith tracing."""
    docs = search_knowledge_base(question)
    response = call_llm(question, docs)
    return {"answer": response, "sources": docs}
@traceable(run_type="retriever")
def search_knowledge_base(query: str) -> list[str]:
    """Search vector store for relevant documents."""
    # Retrieval logic here...
    return ["Relevant document content..."]
@traceable(run_type="llm")
def call_llm(question: str, context_docs: list[str]) -> str:
    """Call LLM with retrieved context."""
    context = "\n".join(context_docs)
    response = client.chat.completions.create(
        model="gpt-4o",
        messages=[
        {"role": "system", "content": f"Use this context:\n{context}"},
        {"role": "user", "content": question},
        ],
    )
return response.choices[0].message.content42.6.4 Platform Comparison
| Platform | Open Source? | Self-Host? | Key Differentiator | Best For |
|---|---|---|---|---|
| LangSmith | No | Enterprise only | Deep LangChain integration | LangChain/LangGraph users |
| Langfuse | Yes | Yes | Open source; prompt management | Teams wanting full control |
| Phoenix (Arize) | Yes | Yes | Embedding visualization; eval integration | ML teams with embedding analysis needs |
| LangWatch | Partial | Yes | Guardrails integration; safety monitoring | Safety-focused applications |
| TruLens | Yes | Yes | Feedback functions; modular evaluation | Custom evaluation workflows |
LangSmith is the default for teams already on LangChain or LangGraph; Replit, Klarna, and Elastic publicly reference using LangSmith for production agent tracing. Langfuse (Y Combinator W23) is the self-hosted alternative, used by Khan Academy and Samsara to keep prompt traces inside their own VPCs. Arize Phoenix is preferred by teams that already use Arize for traditional ML monitoring (e.g., Uber, Lyft) so the LLM traces sit next to model-drift dashboards. WhyLabs and Datadog LLM Observability (launched 2024) compete for the enterprise APM market and slot into existing Datadog deployments at Vercel, Notion, and Carta. The pattern: pick observability based on what your team already runs for non-LLM services, then standardize.
42.6.5 Structured Logging Patterns
Even with dedicated tracing platforms, structured logging remains essential for debugging, auditing, and compliance. LLM-specific logging should capture prompt templates, variable values, model responses, token usage, latency, and any evaluation scores. Use structured (JSON) logging rather than plain text to enable automated parsing and analysis. The production engineering patterns in Chapter 62 extend these logging practices to full deployment pipelines.
# Define JSONFormatter; implement format, log_llm_call, wrapper
# See inline comments for step-by-step details.
import logging
import json
import time
from datetime import datetime, timezone
from functools import wraps
# Configure JSON structured logging
class JSONFormatter(logging.Formatter):
    def format(self, record):
        log_data = {
            "timestamp": datetime.now(timezone.utc).isoformat(),
            "level": record.levelname,
            "message": record.getMessage(),
            }
        if hasattr(record, "llm_data"):
            log_data.update(record.llm_data)
            return json.dumps(log_data)
            logger = logging.getLogger("llm_app")
            handler = logging.StreamHandler()
            handler.setFormatter(JSONFormatter())
            logger.addHandler(handler)
            logger.setLevel(logging.INFO)
    def log_llm_call(func):
        """Decorator to log LLM calls with structured metadata."""
        @wraps(func)
        def wrapper(*args, **kwargs):
            start = time.time()
            try:
                result = func(*args, **kwargs)
                latency_ms = (time.time() - start) * 1000
                record = logger.makeRecord(
                    "llm_app", logging.INFO, "", 0,
                    f"LLM call: {func.__name__}", (), None
                    )
                record.llm_data = {
                    "event": "llm_call",
                    "function": func.__name__,
                    "latency_ms": round(latency_ms, 1),
                    "status": "success",
                    }
                logger.handle(record)
                return result
            except Exception as e:
                latency_ms = (time.time() - start) * 1000
                record = logger.makeRecord(
                    "llm_app", logging.ERROR, "", 0,
                    f"LLM call failed: {func.__name__}", (), None
                    )
                record.llm_data = {
                    "event": "llm_call_error",
                    "function": func.__name__,
                    "latency_ms": round(latency_ms, 1),
                    "error": str(e),
                    }
                logger.handle(record)
                raise
return wrapper{"timestamp": "2026-05-18T14:23:11.847+00:00", "level": "INFO", "message": "LLM call: chat_completion", "event": "llm_call_success", "function": "chat_completion", "latency_ms": 842.3, "prompt_tokens": 124, "completion_tokens": 187, "model": "gpt-4o-2024-08-06"}
{"timestamp": "2026-05-18T14:23:12.961+00:00", "level": "INFO", "message": "LLM call: chat_completion", "event": "llm_call_success", "function": "chat_completion", "latency_ms": 1103.8, "prompt_tokens": 96, "completion_tokens": 213, "model": "gpt-4o-2024-08-06"}42.6.6 Alerting for LLM Applications
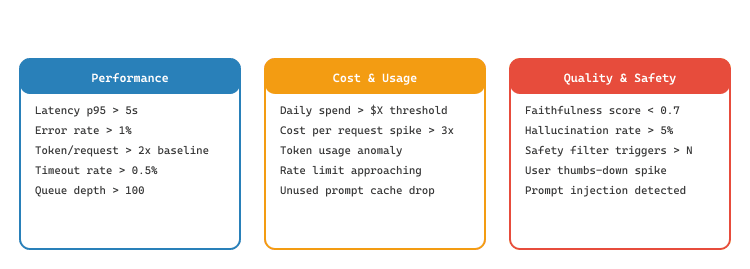
Production LLM applications need alerting on metrics that traditional monitoring does not cover. In addition to standard alerts (error rate, latency p95, availability), LLM-specific alerts should track token usage spikes, cost anomalies, quality score degradation, and safety violations. Figure 42.6.2a categorizes alert types for production LLM applications.
from dataclasses import dataclass
from typing import Callable, Optional
@dataclass
class AlertRule:
    """Definition of an alerting rule for LLM monitoring."""
    name: str
    metric: str
    threshold: float
    comparison: str # "gt" (greater than) or "lt" (less than)
    window_minutes: int = 15
    severity: str = "warning" # warning, critical
    notify_channel: str = "slack"
class LLMAlertManager:
    """Manages alerting rules for LLM applications."""
    DEFAULT_RULES = [
        AlertRule("High Latency", "latency_p95_ms", 5000, "gt", severity="warning"),
        AlertRule("Error Rate", "error_rate", 0.01, "gt", severity="critical"),
        AlertRule("Cost Spike", "cost_per_request_usd", 0.10, "gt", severity="warning"),
        AlertRule("Low Faithfulness", "faithfulness_score", 0.7, "lt", severity="critical"),
        AlertRule("Hallucination Spike", "hallucination_rate", 0.05, "gt", severity="critical"),
        ]
    def __init__(self, rules: Optional[list[AlertRule]] = None):
        self.rules = rules or self.DEFAULT_RULES
    def check_metrics(self, current_metrics: dict) -> list[dict]:
        """Evaluate all rules against current metrics."""
        fired = []
        for rule in self.rules:
            if rule.metric not in current_metrics:
                continue
            value = current_metrics[rule.metric]
            triggered = (
                (rule.comparison == "gt" and value > rule.threshold)
                or (rule.comparison == "lt" and value < rule.threshold)
                )
            if triggered:
                fired.append({
                    "alert": rule.name,
                    "severity": rule.severity,
                    "metric": rule.metric,
                    "value": value,
                    "threshold": rule.threshold,
                    })
return firedStart with a small set of high-signal alerts and expand gradually. Alert fatigue is a real problem: if your team receives dozens of alerts per day, they will start ignoring them. Focus on the metrics that directly indicate user-facing problems (error rate, safety violations, severe quality drops) and set thresholds conservatively. Use warning-level alerts for early signals and critical-level alerts for immediate action items.
Who: Platform reliability team at a legal research company running a RAG-based case law assistant
Situation: Users reported intermittent slowness where queries that normally returned in 3 seconds occasionally took 25+ seconds. Traditional APM tools showed the overall request duration but not which internal step was slow.
Problem: The pipeline had 5 steps (query expansion, embedding, retrieval, re-ranking, generation), each calling different services. Without step-level tracing, reproducing and diagnosing the latency spikes was nearly impossible.
Dilemma: Adding comprehensive tracing to every step would increase code complexity and add small overhead to every request. But without it, the team was spending hours per incident on manual log correlation.
Decision: The team instrumented the entire pipeline with Langfuse using decorator-based tracing, adding @observe to each pipeline step with minimal code changes.
How: Each step was wrapped with @observe, automatically capturing inputs, outputs, latency, and token counts. They set up Langfuse dashboards showing p50/p95/p99 latency per step and configured alerts for any step exceeding its p99 baseline by 3x. Traces included the full context: query text, retrieved document IDs, and model parameters.
Result: Within 24 hours, traces revealed that the re-ranking step occasionally timed out when the retriever returned more than 30 documents (happening on broad legal queries). The fix was simple: cap retrieved documents at 25 before re-ranking. Incident investigation time dropped from hours to minutes because engineers could inspect the exact trace of any slow request.
Lesson: Decorator-based tracing adds observability to LLM pipelines with minimal code changes, and the investment pays for itself the first time you need to diagnose a production issue.
Adding tracing does not automatically make your system observable. Many teams instrument every LLM call but never build dashboards or set alerts, leaving the data unused. Observability requires three components working together: (1) instrumentation that captures data, (2) dashboards that surface patterns, and (3) alerts that trigger action. Tracing without dashboards and alerts is logging to /dev/null with extra steps.
Monitor average tokens per request and total daily token consumption. A sudden spike (2x or more above baseline) often indicates prompt injection, infinite loops, or unexpected input patterns. Catch these early before they drain your budget.
Use Phoenix for local LLM observability with trace visualization and embedding analysis.
Show code
# pip install arize-phoenix
import phoenix as px
# Launch local UI for trace inspection
session = px.launch_app()
print(f"Phoenix UI: {session.url}")
# Retrieve and inspect traces programmatically
from phoenix.trace import SpanEvaluations
evals = SpanEvaluations(
    eval_name="hallucination",
    dataframe=px.Client().get_spans_dataframe()
)
print(evals.dataframe[["context.span_id", "score"]].head())Open Questions in LLM Observability (2024-2026):
- Vendor-neutral telemetry for LLMs: Auto-instrumentation, the GenAI Semantic Conventions, custom span attributes, and exporter choices for OpenTelemetry-based LLM observability are covered in depth in Section 42.9.
- Real-time quality scoring: Moving evaluation from batch (offline) to streaming (inline) so that every production response gets a quality score in real-time, enabling immediate alerting on quality degradation rather than delayed detection.
- Privacy-preserving tracing: Logging full prompts and responses raises privacy concerns. Differential privacy techniques for trace data and selective logging strategies are active research areas.
Explore Further: Instrument a LangChain or LlamaIndex pipeline with Langfuse tracing, then analyze the resulting traces to identify the slowest component and the most token-expensive step.
- Instrument every LLM call. Every LLM invocation, retrieval query, and tool call should be traced with inputs, outputs, latency, and token counts. You cannot debug production issues without this data.
- Use decorator-based tracing for minimal code changes. Both Langfuse (
@observe) and LangSmith (@traceable) offer decorator-based APIs that add tracing with minimal changes to existing code. - Choose your platform based on constraints. Self-hosting needs favor Langfuse or Phoenix. LangChain ecosystems favor LangSmith. Safety-focused teams should consider LangWatch. All platforms provide the core tracing capability.
- Structured logging complements tracing. Traces show individual request flows; structured logs enable aggregate analysis across all requests. Use both together for complete observability.
- Alert on LLM-specific metrics. Go beyond traditional error rate and latency alerts. Monitor faithfulness scores, cost anomalies, token usage patterns, and safety violations to catch LLM-specific production issues early.
1. What is the difference between a trace and a span in LLM observability?
Show Answer
2. How does the Langfuse OpenAI wrapper simplify tracing?
Show Answer
from langfuse.openai import openai) is a drop-in replacement for the standard OpenAI client. It automatically captures all LLM call details (model name, prompt, completion, token counts, latency, cost) without requiring any code changes to existing API calls. When used within a function decorated with @observe(), it automatically attaches the LLM call as a child span in the current trace.3. Why is structured (JSON) logging preferred over plain text logging for LLM applications?
Show Answer
4. What LLM-specific metrics should trigger production alerts that traditional monitoring would not cover?
Show Answer
5. When would you choose Langfuse over LangSmith for your project?
Show Answer
Exercises
Explain the difference between traditional application logs and LLM traces. Why are logs alone insufficient for debugging LLM applications?
Answer Sketch
Logs are flat, timestamped text entries. Traces are hierarchical, structured records that capture the full execution path of a request with parent-child relationships between spans. LLM applications involve multiple asynchronous steps (retrieval, prompt construction, LLM call, post-processing) where the relationship between steps matters. Logs cannot easily represent this hierarchy or link related operations across services. Traces capture inputs, outputs, latency, and metadata at each span, enabling root-cause analysis.
You are building an agent that can search the web, query a database, and call an LLM. Design the span hierarchy for a request where the agent decides to first search the web, then query the database, then synthesize both results with the LLM. What metadata should each span capture?
Answer Sketch
Root span: "Agent Request" (query, user_id, total_latency). Child 1: "Planning" (LLM call to decide tool order, model, tokens). Child 2: "Web Search" (query string, number of results, latency). Child 3: "DB Query" (SQL query, row count, latency). Child 4: "Synthesis" (LLM call with retrieved context, model, input/output tokens, latency, cost). Each span includes start/end timestamps, status (success/error), and any error messages.
Write a Python code snippet that uses the OpenTelemetry SDK to create a trace with three spans for an LLM application: "embed_query," "vector_search," and "llm_generate." Each span should record relevant attributes.
Answer Sketch
Import opentelemetry.trace, get a tracer, and use tracer.start_as_current_span("embed_query") context managers nested appropriately. Set attributes with span.set_attribute("embedding.model", "text-embedding-3-small"). For the LLM span, record model name, token counts, temperature, and latency. Export to a collector or print to console for development. The key is setting the correct parent-child relationships through context propagation.
Your startup needs an observability solution for an LLM chatbot. You have three engineers, use LangChain, and process 50,000 requests per day. Compare LangSmith, Langfuse, and Phoenix for this use case and recommend one with justification.
Answer Sketch
LangSmith: best LangChain integration (automatic tracing with one line), evaluation features, but commercial SaaS with per-trace pricing. Langfuse: open-source, self-hostable, good LangChain support, lower cost at scale. Phoenix: open-source, strong on evaluation and drift detection, but less LangChain-specific. Recommendation: LangSmith for fastest setup given the LangChain stack and small team, unless data sovereignty or cost is a concern, in which case Langfuse is the better choice.
Tracing captures full prompt inputs and LLM outputs, which may contain PII, confidential data, or sensitive business information. Describe strategies for balancing observability needs with data privacy requirements.
Answer Sketch
Strategies: (1) Redact PII before logging using regex patterns or NER models. (2) Hash sensitive fields (store hash for correlation, not the raw text). (3) Use role-based access controls on trace data. (4) Implement retention policies (auto-delete traces after N days). (5) Log metadata without full content in production, with an option to enable full logging for specific debug sessions. (6) Deploy the observability platform on-premises to avoid sending data to third parties. The right balance depends on regulatory requirements (GDPR, HIPAA) and the sensitivity of the use case.
What Comes Next
In the next section, Section 42.4: LLM Experiment Reproducibility, we cover LLM-specific monitoring and drift detection, tracking model quality over time as inputs and behavior change.