You cannot improve what you cannot observe. And in distributed systems, you cannot observe what you have not instrumented.
Eval, Trace-Sniffing AI Agent
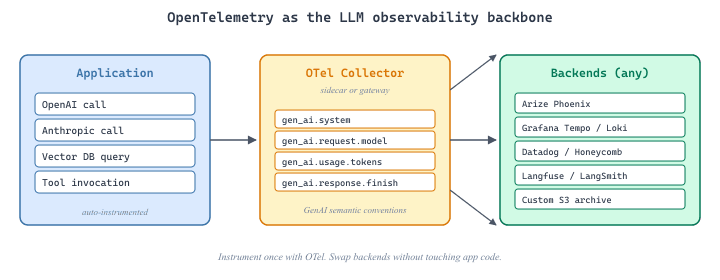
OpenTelemetry provides the standardized observability backbone that makes LLM applications debuggable in production. Without structured tracing, a single user request that touches an embedding model, a vector database, multiple LLM calls, and several tool invocations becomes a black box when something goes wrong. The GenAI Semantic Conventions give every team a common vocabulary for LLM telemetry, enabling unified dashboards across providers and frameworks. This section shows how to instrument LLM applications with OpenTelemetry, from auto-instrumentation libraries to custom span attributes, building on the observability foundations from Section 44.4.
Prerequisites
This section builds on the observability foundations from Section 44.4 and the monitoring patterns in Section 44.6. Familiarity with LLM API calls and tool use patterns is recommended.
42.9.1 Why OpenTelemetry for LLM Systems
OpenTelemetry (OTel) has become the industry standard for distributed tracing, metrics, and logging across microservices. LLM applications pose unique observability challenges that generic application monitoring tools cannot address. A single user request may traverse an embedding model, a vector database, a retrieval pipeline, one or more LLM calls, and several tool invocations. Each step adds latency, cost, and potential failure points. Without structured tracing that captures LLM-specific metadata (token counts, model identifiers, prompt templates, temperature settings), debugging production issues becomes guesswork.
The OpenTelemetry Semantic Conventions for Generative AI (formerly LLM Semantic Conventions)
define a standardized set of span attributes for model calls. These conventions ensure that traces
from different LLM providers, frameworks, and custom code share a common vocabulary. Attributes
like gen_ai.system, gen_ai.request.model,
gen_ai.usage.input_tokens, and gen_ai.usage.output_tokens allow you
to build unified dashboards regardless of whether you call OpenAI, Anthropic, or a self-hosted
model. The deployment patterns in Section 70.5 benefit directly from this standardized telemetry.
The key benefit of OTel over proprietary tracing solutions (LangSmith, Langfuse) is vendor neutrality. OTel traces can be exported to any compatible backend: Jaeger, Grafana Tempo, Datadog, Honeycomb, or your own collector. This avoids lock-in and allows teams to integrate LLM observability into their existing monitoring stack rather than maintaining a separate system. That said, proprietary tools covered in Section 44.4 often provide richer LLM-specific UIs and are easier to set up for teams without existing observability infrastructure.
OpenTelemetry is not a replacement for LLM-specific observability platforms like LangSmith or Langfuse. It is the transport and data model layer that feeds into those platforms (or any other backend). Many LLM observability tools now accept OTel data natively, meaning you instrument once with OTel and send traces to multiple destinations. The choice is not "OTel or LangSmith" but rather "OTel as the instrumentation standard, with LangSmith (or Langfuse, or Datadog) as the visualization and analysis layer."
The first version of the OpenTelemetry GenAI semantic conventions was drafted during a hackathon where engineers from six different LLM observability startups realized they had each invented their own incompatible span attribute names for "number of tokens used." The field name gen_ai.usage.input_tokens exists because seven companies spent a weekend arguing about whether to call it "prompt_tokens," "input_tokens," or "request_tokens."
42.9.2 Instrumenting LLM API Calls
The foundation of LLM observability is instrumenting every model call with a span that captures
the request parameters, response metadata, and timing information. The OpenTelemetry Python SDK
supplies the primitives; the opentelemetry-instrumentation-openai and similar
auto-instrumentation packages handle the most common providers automatically.
from opentelemetry import trace
from opentelemetry.sdk.trace import TracerProvider
from opentelemetry.sdk.trace.export import BatchSpanProcessor
from opentelemetry.exporter.otlp.proto.grpc.trace_exporter import OTLPSpanExporter
from opentelemetry.sdk.resources import Resource

# Initialize the tracer with service metadata
resource = Resource.create({
 "service.name": "my-llm-app",
 "service.version": "1.2.0",
 "deployment.environment": "production",
})

provider = TracerProvider(resource=resource)
processor = BatchSpanProcessor(
 OTLPSpanExporter(endpoint="http://otel-collector:4317")
)
provider.add_span_processor(processor)
trace.set_tracer_provider(provider)

tracer = trace.get_tracer("llm-app.tracer")With the tracer initialized, you can instrument individual LLM calls using the GenAI semantic conventions. Each span should capture the model name, provider, token usage, and any relevant request parameters. This manual instrumentation gives you full control over what is captured, which is important for sensitive applications where you may need to redact prompt content.
import openai
from opentelemetry import trace
from opentelemetry.semconv.attributes import gen_ai_attributes as GenAI

tracer = trace.get_tracer("llm-app.tracer")

async def traced_chat_completion(messages, model="gpt-4o", **kwargs):
    """Wrap an OpenAI chat completion with OTel tracing."""
    with tracer.start_as_current_span(
        "gen_ai.chat",
        attributes={
        GenAI.GEN_AI_SYSTEM: "openai",
        GenAI.GEN_AI_REQUEST_MODEL: model,
        GenAI.GEN_AI_REQUEST_TEMPERATURE: kwargs.get("temperature", 1.0),
        GenAI.GEN_AI_REQUEST_MAX_TOKENS: kwargs.get("max_tokens", 4096),
        }
        ) as span:
        try:
            client = openai.AsyncOpenAI()
            response = await client.chat.completions.create(
                model=model, messages=messages, **kwargs
                )

            # Record response metadata
            usage = response.usage
            span.set_attribute(GenAI.GEN_AI_RESPONSE_MODEL, response.model)
            span.set_attribute(GenAI.GEN_AI_USAGE_INPUT_TOKENS, usage.prompt_tokens)
            span.set_attribute(GenAI.GEN_AI_USAGE_OUTPUT_TOKENS, usage.completion_tokens)
            span.set_attribute("gen_ai.response.finish_reason",
                response.choices[0].finish_reason)

            # Record cost estimate (custom attribute)
            cost = estimate_cost(model, usage.prompt_tokens, usage.completion_tokens)
            span.set_attribute("gen_ai.usage.cost_usd", cost)

            return response

        except Exception as e:
            span.set_status(trace.StatusCode.ERROR, str(e))
            span.record_exception(e)
raiseThe same result in 3 lines with OpenLLMetry (auto-instruments all LLM calls):
Show code
# pip install traceloop-sdk
from traceloop.sdk import Traceloop

Traceloop.init(app_name="my-llm-app")
# All OpenAI, Anthropic, and LangChain calls are now automatically
# traced with GenAI semantic conventions. No manual spans needed.42.9.3 Trace Propagation Through Agent Chains
Single LLM calls are straightforward to trace. The real complexity emerges in agentic systems where a single user request triggers a chain of LLM calls, tool invocations, and sub-agent delegations. Consider a RAG pipeline: the user's query is first embedded, then used for vector search, then the retrieved documents are assembled into a prompt, and finally the LLM generates a response. Each step should be a child span under a single parent trace, preserving the causal chain.
For multi-agent systems,
trace context must propagate across agent boundaries. When an orchestrator agent delegates a
task to a specialist agent, the specialist's spans should appear as children of the orchestrator's
delegation span. If agents communicate via message queues or HTTP, the OTel context propagation
headers (traceparent, tracestate) must be injected into the message
metadata and extracted on the receiving side.
from opentelemetry import trace, context
from opentelemetry.context.contextvars_context import ContextVarsRuntimeContext

tracer = trace.get_tracer("llm-app.agent-chain")

async def rag_pipeline(query: str):
    """Full RAG pipeline with hierarchical tracing."""
    with tracer.start_as_current_span("rag.pipeline") as pipeline_span:
        pipeline_span.set_attribute("rag.query", query)

        # Step 1: Embed the query
        with tracer.start_as_current_span("rag.embed_query") as embed_span:
            embedding = await embed_text(query)
            embed_span.set_attribute("rag.embedding_model", "text-embedding-3-small")
            embed_span.set_attribute("rag.embedding_dim", len(embedding))

            # Step 2: Vector search
            with tracer.start_as_current_span("rag.vector_search") as search_span:
                results = await vector_store.search(embedding, top_k=10)
                search_span.set_attribute("rag.results_count", len(results))
                search_span.set_attribute("rag.top_score", results[0].score)

                # Step 3: Rerank
                with tracer.start_as_current_span("rag.rerank") as rerank_span:
                    reranked = await reranker.rerank(query, results, top_k=5)
                    rerank_span.set_attribute("rag.reranked_count", len(reranked))

                    # Step 4: Generate response (this creates its own child span)
                    context_text = "\n\n".join(r.text for r in reranked)
                    response = await traced_chat_completion(
                        messages=[
                        {"role": "system", "content": f"Context:\n{context_text}"},
                        {"role": "user", "content": query}
                        ],
                        model="gpt-4o"
                        )

                    pipeline_span.set_attribute("rag.total_tokens",
                        response.usage.prompt_tokens + response.usage.completion_tokens)
return response.choices[0].message.contentrag.pipeline span. The traced_chat_completion function from Code Fragment 42.9.6 automatically creates a nested child span for the LLM call. This structure allows you to see exactly where time is spent in the pipeline.Who: A platform engineer at a legal technology company operating a tool-using agent that researched case law and drafted legal summaries.
Situation: The agent used five tools (case search, statute lookup, citation validator, summarizer, and document formatter) and processed roughly 2,000 queries per day.
Problem: Users reported that some queries took over 45 seconds, but the team had no visibility into which tool calls were responsible. Aggregate latency metrics showed only the total request duration, not the per-tool breakdown.
Decision: The engineer instrumented each iteration of the agent loop as a child span under the agent's main OTel span, recording tool name, arguments, execution time, and result size on each tool span.
Result: Tracing revealed that the citation validator was responsible for 60% of total latency on slow queries because it made synchronous HTTP calls to an external API with no timeout. Adding a 3-second timeout and a local cache for frequently cited cases reduced P99 agent latency from 45 seconds to 12 seconds. Token cost attribution also showed that tool result parsing consumed 40% of the agent's total token budget, prompting the team to truncate verbose tool outputs. The cost control patterns in Section 49.3 rely on exactly this granularity of data.
Lesson: Without per-tool-call tracing, agent performance debugging is guesswork. Structured spans for each agent loop iteration make it trivial to identify which tool is the bottleneck and where tokens are being consumed.
42.9.4 Token Tracking and Cost Attribution
Token usage is the primary cost driver for LLM applications. OTel tracing provides the
infrastructure to track tokens at every level of granularity: per call, per pipeline step,
per user session, per feature, and per tenant. By recording gen_ai.usage.input_tokens
and gen_ai.usage.output_tokens on every LLM span, you can aggregate costs across
any dimension using your tracing backend's query language.
Cost attribution becomes critical in multi-tenant applications where different customers or features consume different amounts of LLM resources. By adding custom span attributes for tenant ID, feature name, and user tier, you can build per-tenant cost dashboards. This data feeds directly into billing systems and helps identify features or users that generate disproportionate costs. The cost control strategies in Section 49.3 depend on this level of cost visibility.
from opentelemetry import trace
from dataclasses import dataclass
from typing import Optional

@dataclass
class CostConfig:
    """Per-model pricing (USD per 1K tokens)."""
    input_cost_per_1k: float
    output_cost_per_1k: float

    PRICING = {
        "gpt-4o": CostConfig(0.0025, 0.01),
        "gpt-4o-mini": CostConfig(0.00015, 0.0006),
        "claude-sonnet-4-20250514": CostConfig(0.003, 0.015),
        "claude-haiku-4-20250414": CostConfig(0.0008, 0.004),
        }

class TokenTracker:
    """Track token usage and costs across the application."""

    def __init__(self):
        self.tracer = trace.get_tracer("llm-app.cost-tracker")

    def record_usage(
        self,
        model: str,
        input_tokens: int,
        output_tokens: int,
        tenant_id: Optional[str] = None,
        feature: Optional[str] = None,
        ):
        """Record token usage on the current span with cost attribution."""
        span = trace.get_current_span()
        pricing = PRICING.get(model, CostConfig(0.01, 0.03))

        input_cost = (input_tokens / 1000) * pricing.input_cost_per_1k
        output_cost = (output_tokens / 1000) * pricing.output_cost_per_1k
        total_cost = input_cost + output_cost

        span.set_attribute("gen_ai.usage.input_tokens", input_tokens)
        span.set_attribute("gen_ai.usage.output_tokens", output_tokens)
        span.set_attribute("gen_ai.usage.cost_usd", round(total_cost, 6))

        if tenant_id:
            span.set_attribute("app.tenant_id", tenant_id)
            if feature:
                span.set_attribute("app.feature", feature)

                # Also emit as a metric for real-time dashboards
                from opentelemetry import metrics
                meter = metrics.get_meter("llm-app.cost-meter")
                token_counter = meter.create_counter(
                    "gen_ai.tokens.total",
                    description="Total tokens consumed",
                    )
                cost_counter = meter.create_counter(
                    "gen_ai.cost.usd",
                    description="Estimated cost in USD",
                    )
                token_counter.add(input_tokens + output_tokens, {
                    "model": model, "token_type": "total",
                    "tenant_id": tenant_id or "unknown",
                    })
                cost_counter.add(total_cost, {
                    "model": model,
                    "tenant_id": tenant_id or "unknown",
})TokenTracker records token counts and estimated costs both as span attributes (for per-request analysis) and as OTel metrics (for real-time dashboards and alerting). Custom attributes for tenant and feature enable cost allocation across business dimensions.42.9.5 Auto-Instrumentation with OpenLLMetry
Manual instrumentation provides maximum control but requires modifying every LLM call site. For faster adoption, auto-instrumentation libraries can patch LLM client libraries at import time to automatically generate spans. OpenLLMetry (by Traceloop) is the most mature auto-instrumentation package for LLM applications. It supports OpenAI, Anthropic, Cohere, LangChain, LlamaIndex, ChromaDB, Pinecone, and many other libraries.
# Auto-instrument all supported LLM libraries with one call
from traceloop.sdk import Traceloop

Traceloop.init(
 app_name="my-llm-app",
 # Export to any OTel-compatible backend
 exporter_endpoint="http://otel-collector:4317",
 # Control what gets captured
 tracing_enabled=True,
 metrics_enabled=True,
 # Redact prompt/completion content for privacy
 should_enrich_metrics=True,
)

# Now all OpenAI, Anthropic, LangChain calls are automatically traced
import openai

client = openai.OpenAI()
# This call is automatically instrumented with GenAI semantic conventions
response = client.chat.completions.create(
 model="gpt-4o-mini",
 messages=[{"role": "user", "content": "Explain observability in one sentence."}]
)
# A span is automatically created with model, tokens, latency, and costshould_enrich_metrics flag controls whether prompt and completion content is included in traces.Auto-instrumentation is ideal for getting started quickly, but it captures everything
indiscriminately. In production, you typically want a hybrid approach: auto-instrumentation
for baseline coverage, plus manual spans for business-critical paths where you need custom
attributes (tenant ID, feature flags, A/B test variants). The manual @workflow
and @task decorators from Traceloop can annotate specific functions with
semantic meaning.
Recording full prompt and completion content in traces creates significant privacy and compliance risks. User messages may contain personal information, health data, or other sensitive content subject to GDPR, HIPAA, or similar regulations. Always configure content redaction in production. Most auto-instrumentation libraries support content filtering; use it. Store full prompt/completion logs only in systems with appropriate access controls and retention policies. The privacy and compliance topics in Chapter 47 apply directly here.
- OpenTelemetry is the LLM observability substrate: Distributed tracing, structured spans, and vendor-neutral exporters give you a single language for instrumenting LLM apps end-to-end.
- Instrument the LLM call as a first-class span: Capture model name, prompt and completion tokens, latency, and stop reason as span attributes so every dashboard derives from the same source of truth.
- Trace context propagates through agent chains: Carry the trace ID across tool calls, retrievals, and sub-agents so a single user request becomes one tree you can debug.
- Token tracking enables cost attribution: Per-span token counts roll up into per-user, per-feature, and per-tenant cost dashboards without a separate billing pipeline.
What Comes Next
With OTel instrumentation in place, the next step is to visualize and alert on the resulting telemetry. Continue in Section 42.9a: OTel Dashboards for LLM Operations.